On-chain analysis offers a transparent view into cryptocurrency activity, extending beyond simple price charts. You can track transaction volumes, active addresses, and whale movements to gain a deeper understanding of the proper health of blockchain networks.
Let’s break down on-chain analytics, their impact on investment decisions, and simple ways to use this data effectively.
What is on-chain analysis in crypto?

Blockchain data provides valuable insights into cryptocurrency network activity, user behavior, and overall health through on-chain analysis. You gain a unique advantage by seeing exactly what happens with digital assets immediately.
On-chain analysis examines transaction patterns, wallet holdings, and network metrics that are recorded directly on public blockchains, such as Bitcoin and Ethereum. Blockchain technology creates unprecedented transparency where every movement leaves a permanent trace, unlike traditional financial markets.
How blockchain data is recorded

A network of nodes records blockchain data by continuously documenting immediate information. Public blockchains store every transaction as part of an immutable, transparent digital ledger. It creates several fundamental characteristics:
- Immutability: Blockchain data cannot be altered or tampered with once recorded
- Transparency: Anyone can view all transactions that remain available
- Decentralization: Multiple nodes store data to prevent manipulation
Difference between on-chain and off-chain data
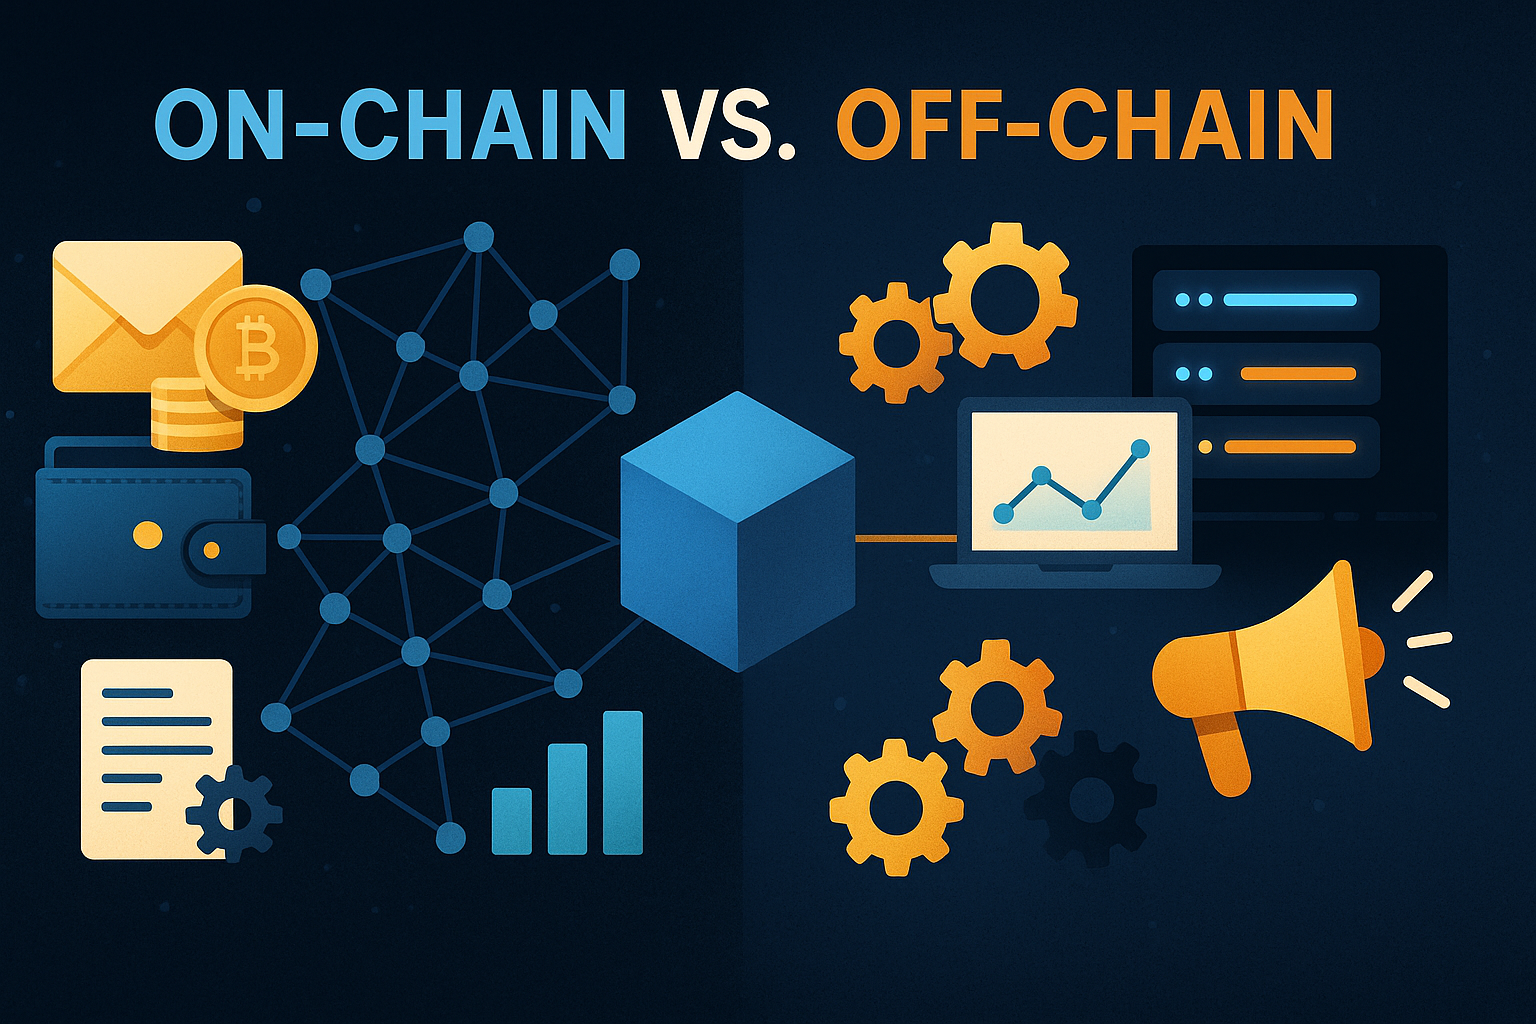
Information recorded directly on the blockchain itself represents on-chain data. It includes:
- Transaction details (sender, receiver, amount)
- Wallet address holdings
- Smart contract executions
- Network fees and activity metrics
Off-chain data exists outside the primary blockchain network. Here is what separates them:
- Recording mechanism: The primary blockchain network processes and records on-chain transactions, while secondary layers handle off-chain transactions
- Verification process: On-chain transactions undergo validation through consensus mechanisms like Proof of Work or Proof of Stake before becoming permanent records
- Speed and cost: Resource-intensive consensus mechanisms make on-chain transactions slower and more expensive
- Data types: Technical analysis, market sentiment, news, and social media trends make up off-chain data
Why on-chain analysis matters

See live activity on the network
Live visibility into blockchain networks provides investors with their most significant advantage through on-chain data. Anyone can view all transactions and events at any time.
Blockchain analytics show exactly how assets flow through the network, unlike traditional markets, where exchange activities stay hidden. You can track big wallet transfers, exchange deposits, and transaction volumes as they happen using tools like Glassnode and Lookonchain.
Spot early signs of market changes
On-chain analysis works like an early warning system for market movements. You can spot potential price shifts before they happen by analyzing exchange inflows and outflows.
Whale activity signals prove especially valuable. Large holders who deposit large amounts of Bitcoin into exchanges may plan to sell soon. Moving coins to private wallets typically indicates long-term holding plans.
Understand user behavior and trends
On-chain analysis reveals how people use cryptocurrency networks. Active address counts refer to the number of unique wallets involved in transactions within specific timeframes. The data enables you to measure actual network usage and demand.
Transaction volume shows economic activity on blockchains. High volumes typically indicate strong network usage and increasing adoption. These patterns help identify which blockchain ecosystems are gaining popularity. Platforms like Nansen and Dune offer helpful dashboards to track these activities.
Key metrics used in on-chain analysis
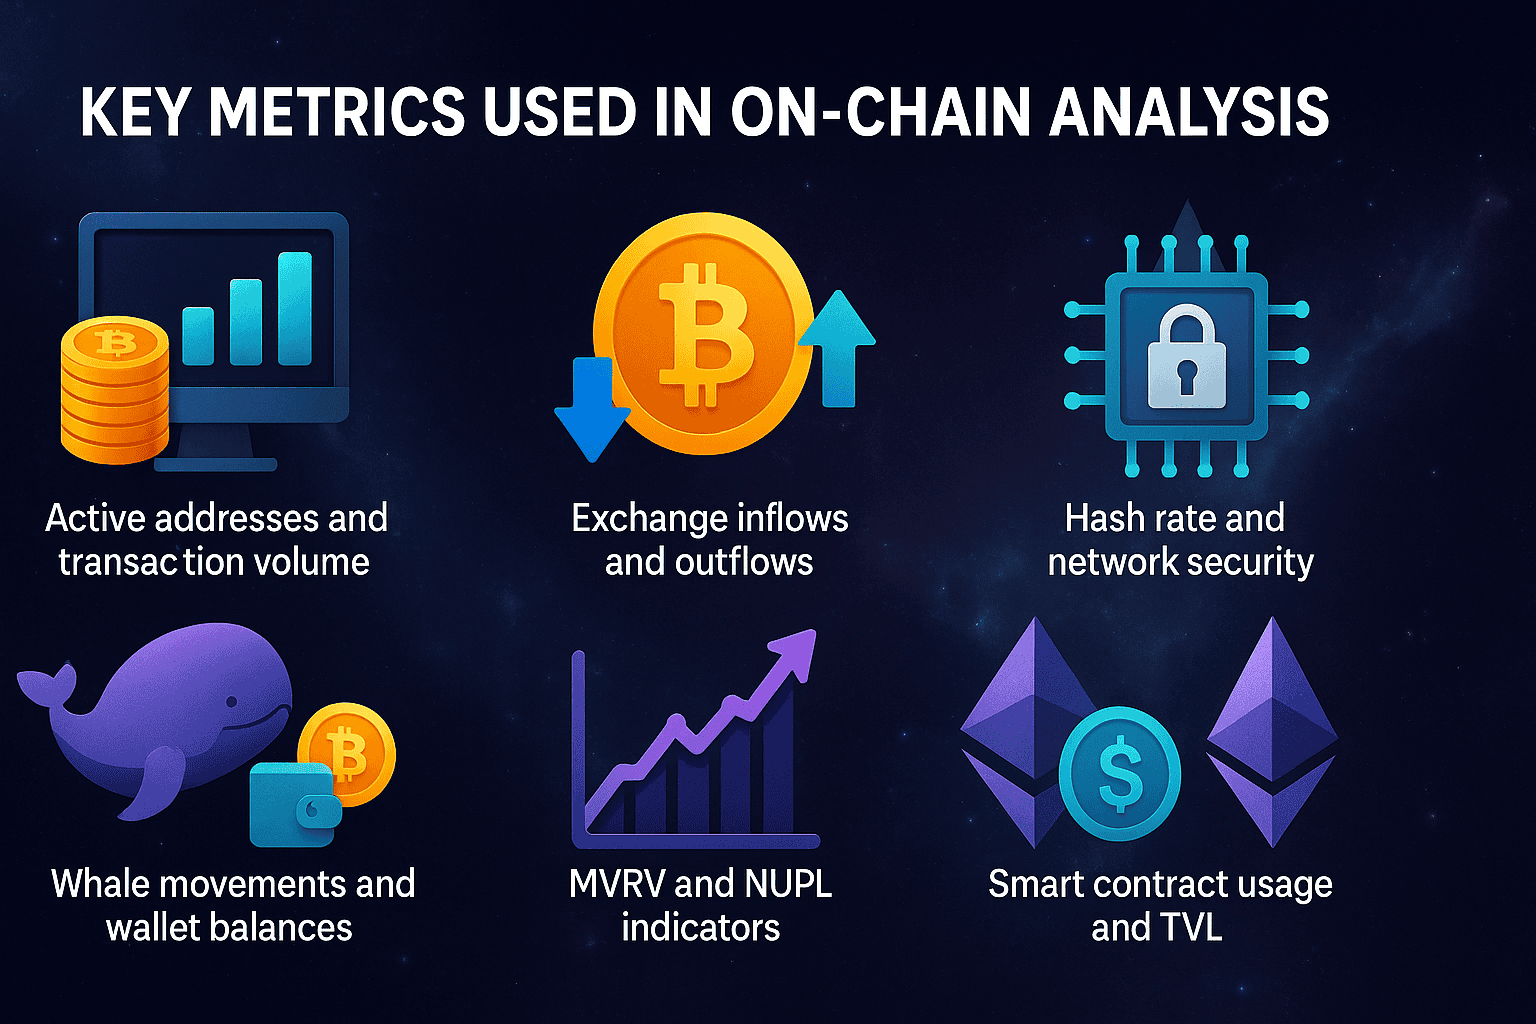
Active addresses and transaction volume
The count of active addresses indicates the number of unique wallets that interact with a blockchain network within a specified period. The number helps measure actual network usage and adoption. More active addresses suggest growing interest that could positively affect prices.
Exchange inflows and outflows
Exchange flows track cryptocurrencies as they enter and exit trading platforms. Higher inflows than outflows mean traders are moving assets to exchanges to sell, which could lead to price drops. The opposite happens when outflows are substantial – investors transfer coins to personal wallets to hold long-term. It limits the available supply on exchanges and could push prices up.
Whale movements and wallet balances
Whale tracking examines major cryptocurrency holders who can significantly influence markets through their trades. Investors can spot potential market changes by watching large wallet patterns (usually $100,000-$10 million in assets). Large transfers to exchanges may indicate that selling pressure is building, while private wallet accumulation suggests market confidence.
MVRV and NUPL indicators
Market Value to Realized Value (MVRV) compares the current market price to the average price at which coins last traded. An MVRV above 1 points to possible overvaluation. Net Unrealized Profit/Loss (NUPL) indicates whether the market is profitable by comparing Realized Value to Market Value and Market Capitalization.
Hash rate and network security
The hash rate indicates the amount of computing power that secures proof-of-work blockchains, such as Bitcoin. A higher hash rate means better network security and miner confidence. The number reflects network health, and steady increases show growing investment in infrastructure.
Beginner tools and tips to get started

Glassnode and IntoTheBlock
Glassnode excels as a leading platform for on-chain analytics, offering pre-built dashboards that display significant blockchain metrics. Users can access over 200 metrics spanning more than 10 years of historical data. The platform’s accessible interface enables tracking of fundamental valuation drivers and market liquidity patterns.
IntoTheBlock also provides accessible visualizations and customizable charts for popular blockchains. The platform shows on-chain analytics in an easy-to-understand format and offers a free tier to explore basic features.
How to read basic charts
On-chain data charts show time-based trends that reveal network activity patterns. Understanding what each metric represents should come before drawing any conclusions. While exploring metrics like active addresses, look for consistent trends rather than daily fluctuations.
Start with one or two metrics
Your data analysis should begin with just one or two fundamental metrics. Exchange flows make great starting points because they help measure potential market pressure. Active addresses and transaction volumes show clear signs of actual network usage. A narrow focus builds confidence and prevents feelings of overwhelm.
Avoid overreacting to single data points
On-chain analysis is most effective when examining patterns over time rather than isolated events. A single significant transaction may not show a market trend, but repeated movements from multiple whales suggest meaningful changes. Data should be verified across various reliable sources.
The Power of Blockchain Transparency
Blockchain transparency provides crypto market traders with a significant edge. Traditional investments keep their internal data hidden, but blockchain technology reveals every movement of digital assets. Market participants can identify upcoming trends by monitoring key metrics, including exchange flows and whale movements.
Note that consistent patterns tell more than single events. While one whale’s move may not seem significant, trends across multiple metrics signal fundamental market changes. Savvy investors combine on-chain data with traditional analysis to get a complete view of cryptocurrency health.
Price shouldn’t be your only consideration when investing in crypto. Active addresses, transaction volumes, and exchange flows paint a clearer picture. These metrics show what is happening with a cryptocurrency in the present, not just predictions about its future.